🔎 A NEW PERSPECTIVE ON PASSENGER MOBILITY
🔎 A NEW PERSPECTIVE ON PASSENGER MOBILITY
A new look at passenger mobility: Futura-Mobility has worked with students from the Urban School at Sciences Po Paris to develop innovative indicators for comparing modes of transport
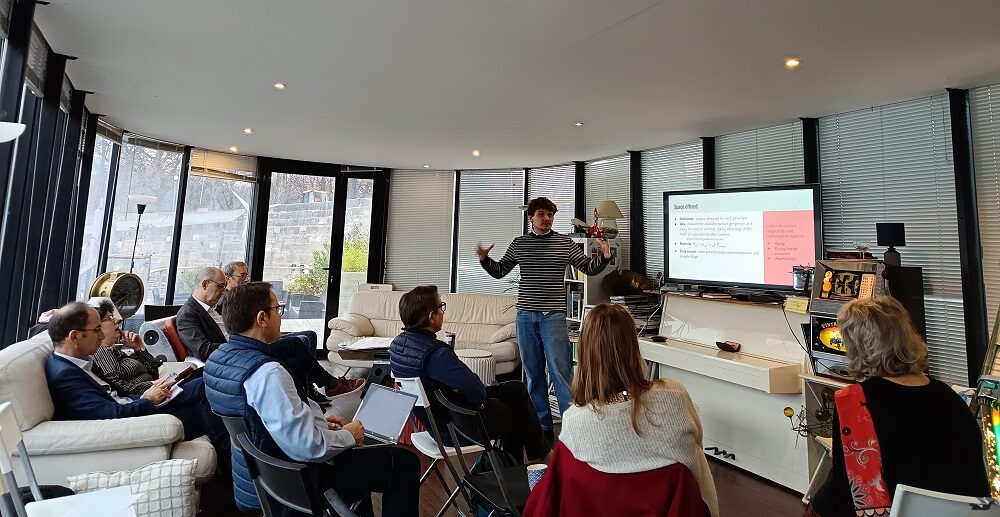
Carried out during the 2023-2024 academic year, the project involved four students, with full gender parity, from different backgrounds and nationalities. The lead tutor was Adrien Sartre, technical adviser at Ville de Paris in charge of pedestrian and bicycle policies, and since then a lecturer at Sciences Po. The study aimed to develop new indicators for comparing modes of transport that meet the needs of both passengers and decision-makers.
This work, a first step by Futura-Mobility towards stimulating public debate, is destined to be improved and enriched – any suggestions you may have are very welcome!
The need for new indicators
The study highlighted the lack of comprehensive indicators for comparing modes of transport. The existing indicators available on good mobile apps, such as price, journey times, and CO2 emissions, fail to reflect all the challenges facing mobility.
Futura-Mobility, a think-tank bringing together major players in the mobility sector, therefore wanted to develop other objective and relevant indicators – in addition to those that already exist – to inform choices of both passengers and decision-makers.
“The ultimate dream? To develop a ‘Yuka’ for transport,” explains Jean-Jacques Thomas, chairman of the think-tank and AI coordinator for SNCF Voyageurs TER, referring to the app used to inform consumer choices in the food sector.
A people-centred approach to developing common indicators
Today, there is a surprising lack of indicators providing for an objective and comprehensive comparison of the different modes of transport. Each sector uses its own metrics, making it difficult to make an overall assessment of the advantages and disadvantages of each mode. This lack of cross-sector indicators limits the ability of users to make informed choices and hampers decision making by policy-makers. Hence the importance of developing new analytical tools to gain a better understanding of mobility issues and challenges.
The study by Futura-Mobility with the Urban School of Sciences Po Paris proposes an innovative user-centred approach. Instead of focusing solely on costs, journey times, and greenhouse gas emissions, the study sought to take into account other passenger priorities, as well as those of public decision-makers.
The aim was to create indicators that meet current mobility concerns, such as sustainability, accessibility, comfort, and digitalisation. These indicators, once integrated into Mobility as a Service (MaaS) apps, could help users to make better informed transport choices.
Methodology: using megatrends and challenges as a starting point for identifying the right indicators
The study was carried out in several stages, involving an in-depth literature review, creating ‘personas’ to represent different types of user, and field studies in four European cities: Amsterdam in the Netherlands, Bratislava in Slovakia, Budapest in Hungary, and Castellón de la Plana in Spain.
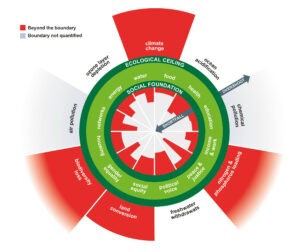
👉 Identifying megatrends: the study first identified the major trends influencing mobility today, like the ageing population, urbanisation, digitalisation, and growing environmental awareness.
👉 Analysing challenges: the challenges facing mobility were analysed, including accessibility, climate change mitigation, air pollution, and biodiversity loss.
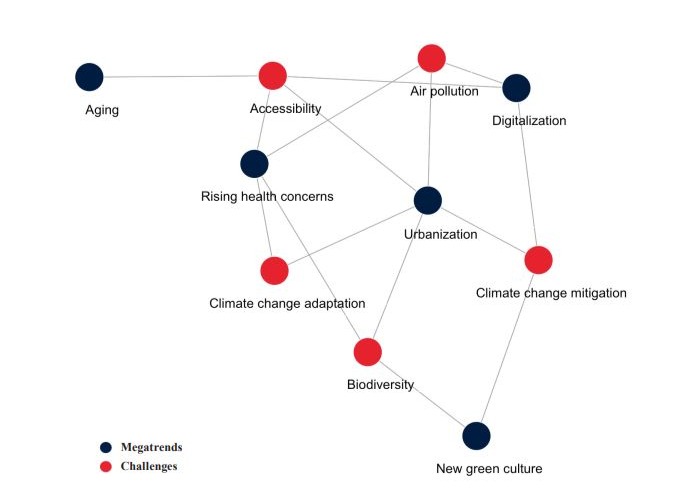
The next phase then involved defining the indicators, using the ‘personas’ identified by the students as typical travellers and the established framework of the issues. The students developed six new indicators:

✔️ Useful time (to be compared/coupled with door-to-door time)
‘Useful’ time is time spent on transport that can be used for productive activities. It should be compared with the door-to-door time taken to make the journey.
So ‘useful’ time, i.e. potentially productive time, is travel time during which:
– During the day, between 7am and 10pm: the sub-indicator dedicated to the possible use of a laptop during the day is at least equal to 1, i.e. there is at least one tablet available, and if possible Internet connectivity (the sub-indicator then takes the value 2) and an available power socket (value 3 if the other two preconditions are met).
– At night, between 10pm and 7am, passengers can lie down.
✔️ Punctuality
Calculated for a given origin-destination and given mode of transport, punctuality is the proportion of ‘late’ journeys in relation to the total number of journeys.
The notion of ‘delay’ is defined as follows to take account of the different sensitivities of passengers to long and short journeys. A delay is defined as a journey lasting more than 1.5 times the square root of the expected journey length. It was decided not to make this a linear function (the longer the journey, the longer the ‘delay’ has to be to be perceived) so that this perception can be ‘smoothed out’.
So, according to this definition, a 20-minute journey is said to be ‘late’ if it exceeds the journey time by 6 to 7 minutes, and a 3-hour journey is ‘late’ if it exceeds the journey time by just over 20 minutes (and not 58 minutes had a linear function been used).
✔️ Available space per passenger
Available space is the space, in square metres, provided for each passenger in a given mode of transport. It is calculated by taking the total space within the mode t, minus the space taken up by equipment, fixtures and fittings, brought to the maximum number of passengers for the mode in question.
✔️ Utilisation rate of elderly people
‘Elderly people’ are considered to be aged 65 and over.
The utilisation rate is the deviation from the average usage of the given mode of transport. So if 100 is the reference base for the population as a whole, the rate will be the difference in points between use (in passenger-kilometres) of this mode by elderly people and the population as a whole. It is therefore a case of over- or under-use of the transport mode by this category of passenger.
✔️ Heat peak potential
The heat peak potential of a mode of transport is the percentage of journeys where a temperature difficult to bear has been reached in this mode in relation to the total number of journeys made. The maximum bearable temperature is defined by a humidex (perceived heat, temperature combined with humidity level) greater than or equal to 30°C.
✔️ Land use
Land use is expressed in square metres for a given journey using a given mode of transport. The indicator is calculated by dividing the square kilometres occupied on the ground by the infrastructure by the number of passenger-km using that infrastructure, then multiplying by the length of the given journey.
The indicators reflect the challenges facing mobility.
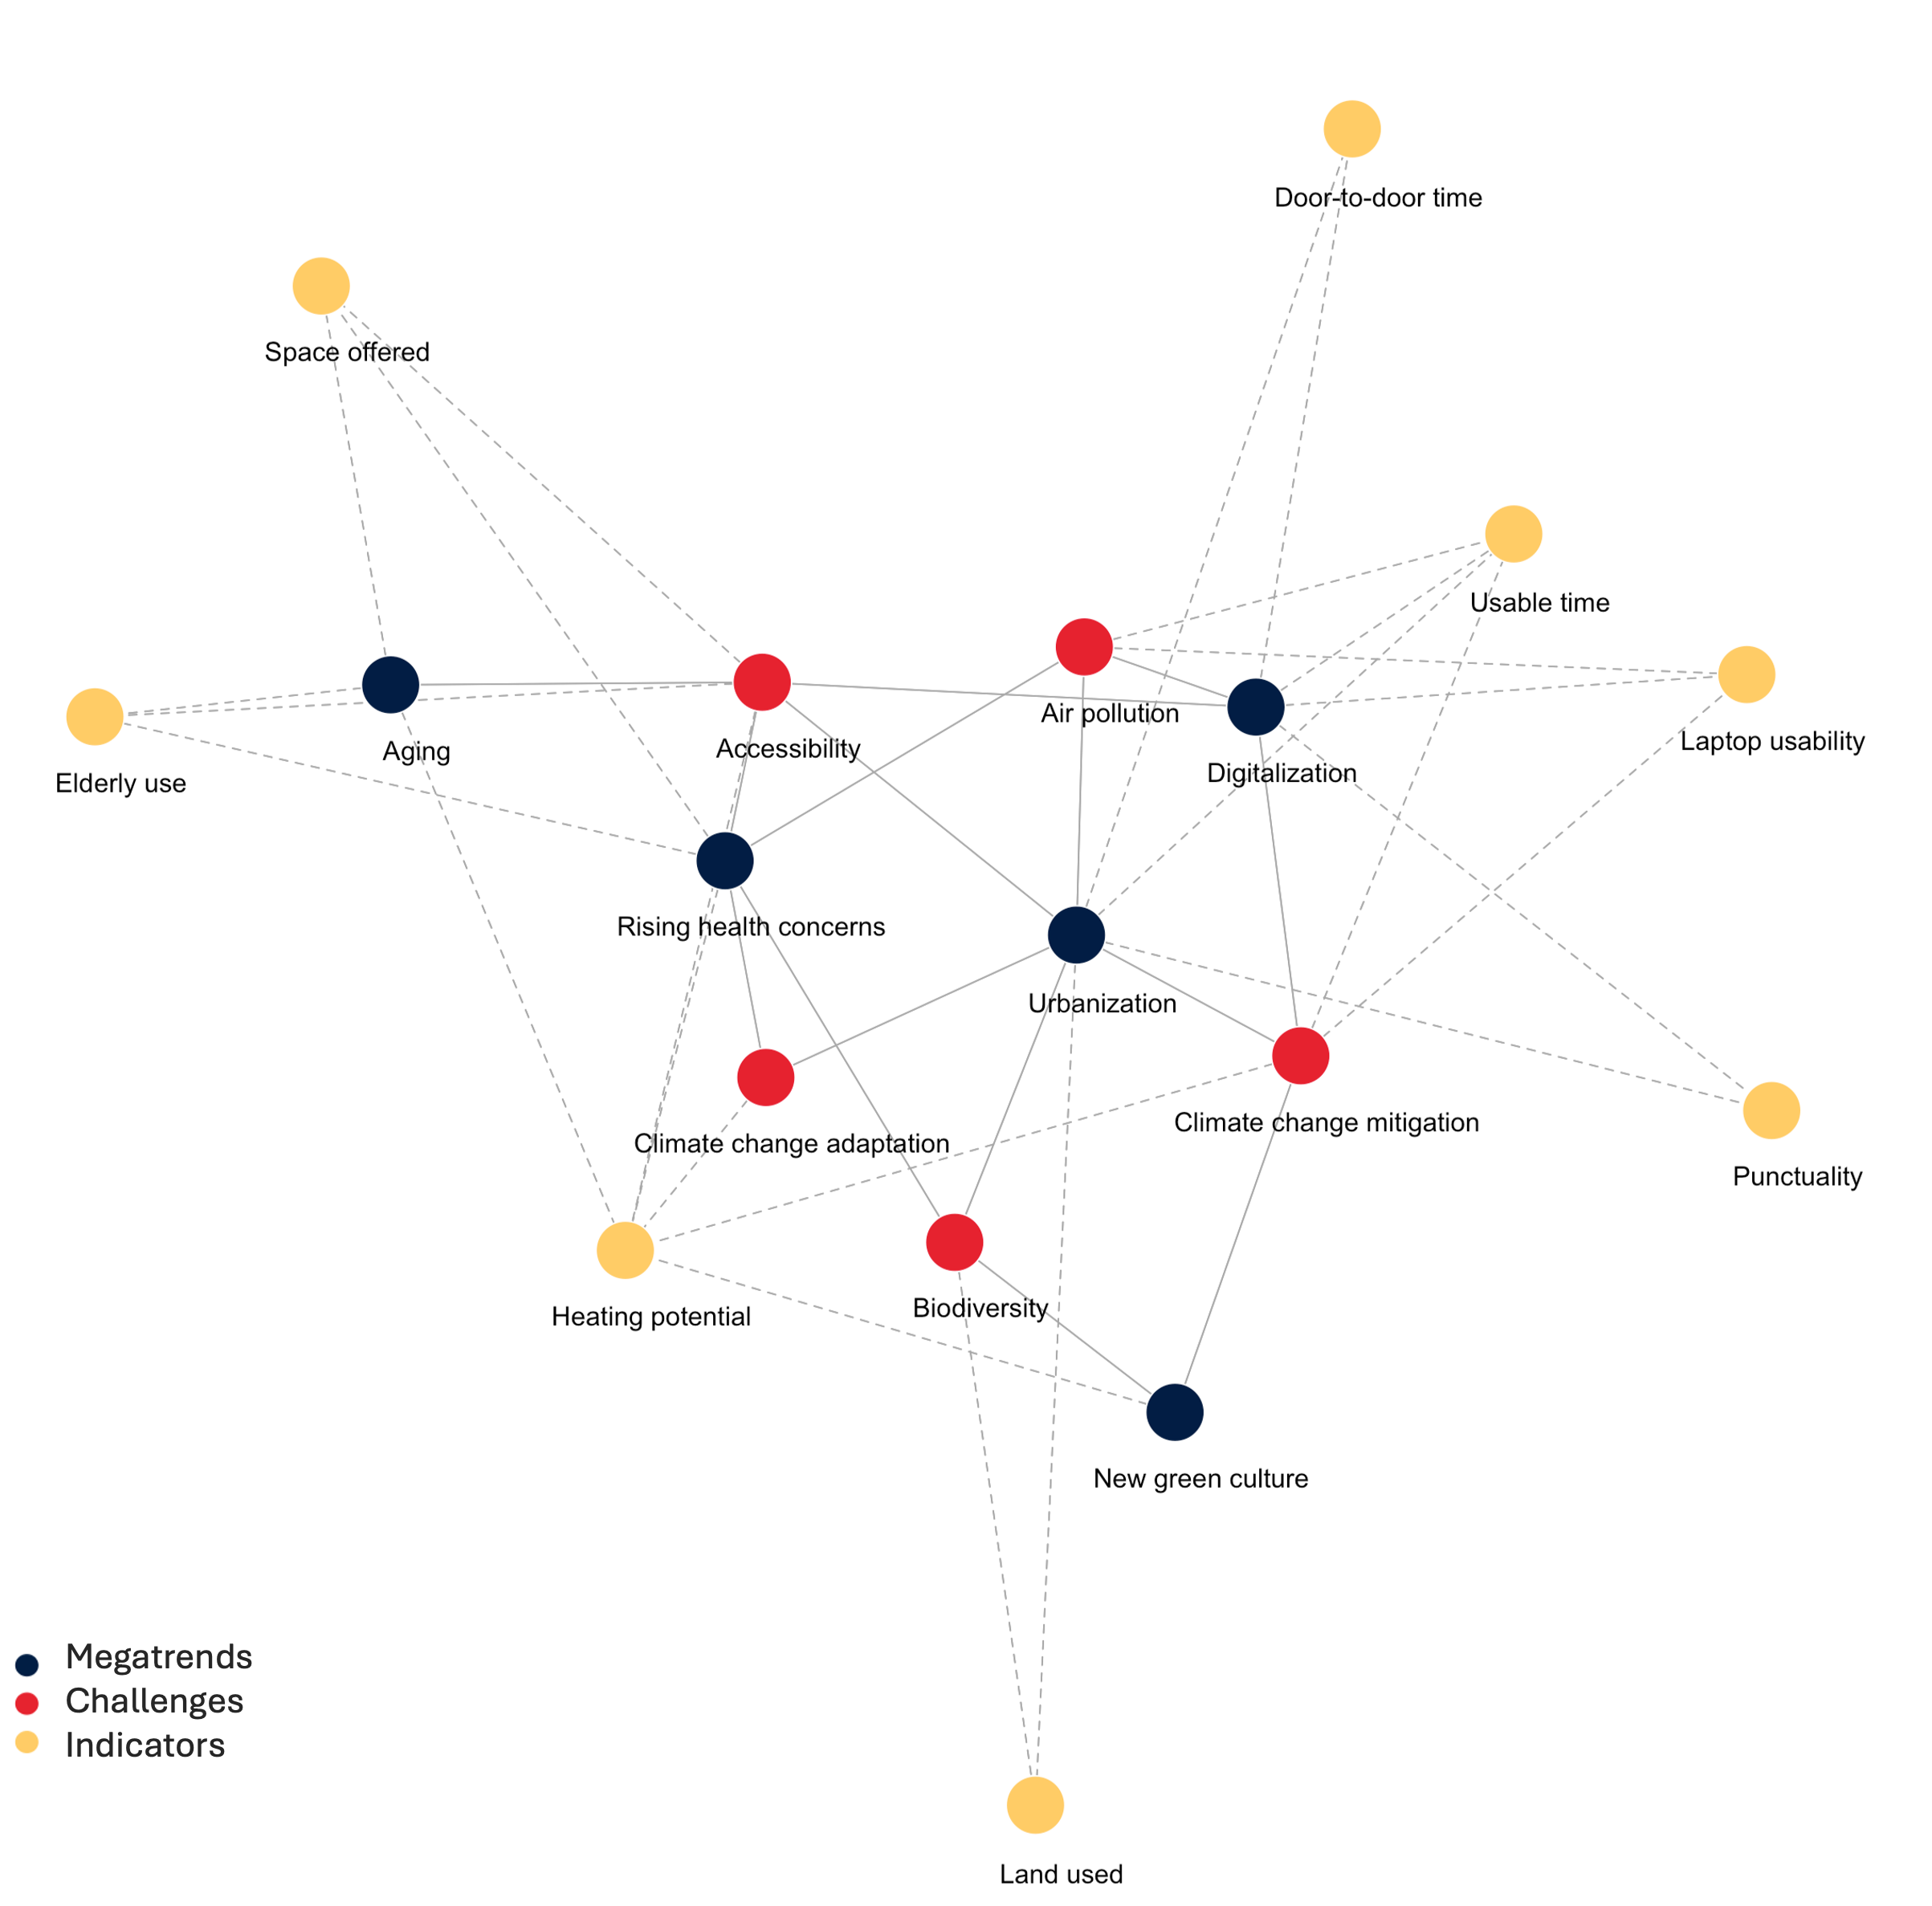
Relevant indicators, but limited data
The field studies confirmed the relevance of the proposed indicators. Interviews with passengers and mobility professionals were used to assess the relevance of the indicators and identify their limitations. They revealed that time-related indicators, like punctuality, door-to-door times, and useful time, were considered particularly relevant. Comfort indicators (heat peak potential, space available) and land use require explanation but are seen as fairly relevant for over 50% of respondents, while the utilisation rate by elderly people is seen as less relevant for over 50% of respondents.
However, we may well ask whether the relevance of an indicator assessed by passengers and professionals will suffice to bring about changes in public policy and uses?
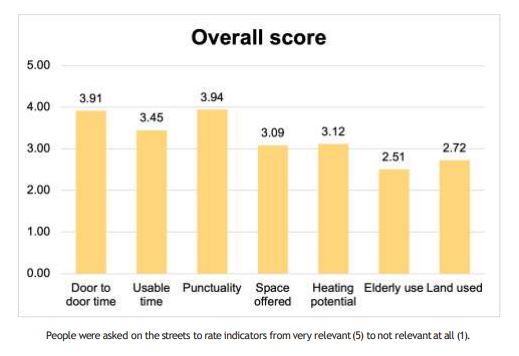
However, the study also highlighted the difficulty of accessing reliable and complete data for calculating certain indicators. The lack of open data and the complexity of collecting information in the field limited the scope of the analysis.
Some indicators could nevertheless be approximated on certain journeys by the students, highlighting the value of comparability between modes of transport, even if these results cannot be generalised at this stage:

In conclusion, the study demonstrated the importance of developing new mobility indicators to gain a better understanding of passengers’ needs and inform political decisions on mobility issues. The proposed indicators are a first step towards a more comprehensive and objective assessment of transport modes, which should be taken up, honed and supplemented through research work on mobility.
